
Windsor and Maidenhead prices rose 2.3% in August, joint eighth biggest monthly rise in England, leaving the annual fall at just 0.2%. Flats are still down.
The average home in Windsor and Maidenhead sold for £583,688 in August 2026. That is up 2.3% on July, the joint eighth biggest monthly rise of the 295 English local authority districts. Slough, next door, rose by the same 2.3%.
The jump almost wipes out the borough’s annual fall. Prices are now down 0.2% on August 2025, a drop of about £1,000. A month earlier the annual fall was 4.6%.
The figures come from the HM Land Registry UK House Price Index for August 2026, published on 21 October. The index is a mean average, not a median, so a handful of very expensive sales can move it more than in most of England.
Why the annual figure changed so fast
Most of the swing is about last year, not this one. Prices in the borough peaked at £598,613 in July 2025 and then fell 2.3% in August 2025. So this July was being compared with a record month, and this August with a weaker one.
The level of prices has moved less than the annual figure suggests:
- August 2026: £583,688, the highest since October 2025 (£593,049)
- July 2026: £570,779
- January 2026: £561,096, the lowest point in the last two years
- August 2025: £584,667
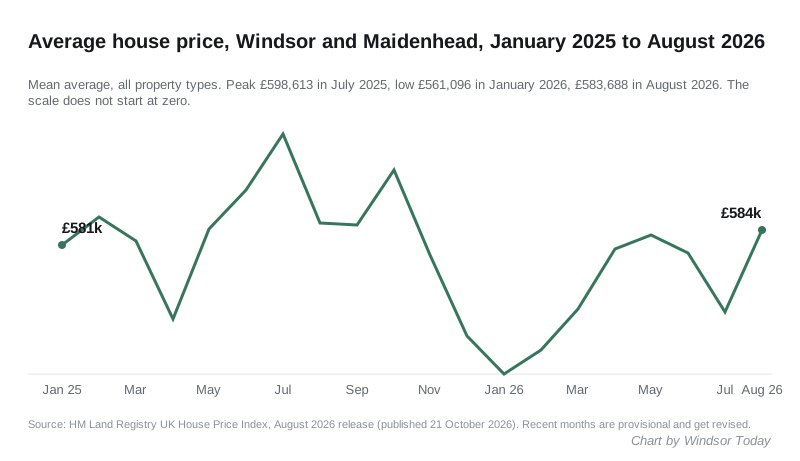
July has also been revised down. When we reported the July figures in September, the index gave £575,036 and a 3.9% annual fall. The August release now puts July at £570,779, down 4.6%. Revisions like this are normal: the Land Registry adds sales to recent months as they are registered.
Which homes rose and which fell
| Property type | Average price, August 2026 | Change on a year |
|---|---|---|
| Detached | £1,142,002 | up 0.4% |
| Semi-detached | £611,223 | up 1.0% |
| Terraced | £491,374 | up 1.0% |
| Flat | £307,916 | down 2.7% |
| First-time buyer | £434,955 | down 0.3% |
| Home mover | £725,822 | up 0.1% |
Flats are still the weak spot. They were down 6.9% on the year in the revised July figures and are still 2.7% down in August. Houses of every type are now slightly up on a year ago.
Buyers paying cash paid an average of £598,365. Buyers with a mortgage paid £579,628.
How the borough compares
Windsor and Maidenhead is still the 18th most expensive district in England. Nationally, the average price rose 0.4% on the year to £293,525, so the borough remains well behind the national trend, though by much less than in July.
Across Berkshire, only Slough rose:
| District | Average price, August 2026 | Change on a year |
|---|---|---|
| Windsor and Maidenhead | £583,688 | down 0.2% |
| Wokingham | £491,944 | down 2.5% |
| West Berkshire | £401,830 | down 0.4% |
| Bracknell Forest | £391,521 | down 2.3% |
| Reading | £350,501 | down 0.4% |
| Slough | £349,397 | up 0.4% |
In England, 107 of the 295 districts recorded a fall on the year. Windsor and Maidenhead’s 0.2% dip ranks 103rd from the bottom, so it is now in the middle of the fallers rather than near the front of them. In the July figures as first published, it had the 18th steepest fall.
Fewer sales are being recorded
The Land Registry’s sales counts run about two months behind the prices. The latest is June 2026, with 105 sales recorded in the borough, against 135 in June 2025. Those counts are provisional and usually rise as late registrations arrive, so treat the gap with caution.
What it means for you
- If you are selling a house: prices for detached, semi-detached and terraced homes are now slightly above a year ago. The borough-wide average is back to roughly where it was in August 2025.
- If you are selling a flat: flats are still down 2.7% on the year, at an average of £307,916.
- If you are buying for the first time: the first-time buyer average is £434,955, down 0.3% on the year.
- If you are reading the headlines: one strong month does not make a recovery. The figure for August can be revised next month, as July was.
Our Windsor house prices page has the longer picture, and the council tax bands page shows what each band costs in 2026/27.
Sources
- HM Land Registry, UK House Price Index, August 2026 release, published 21 October 2026, and the full data file for August 2026, downloaded 24 October 2026. All prices, changes, rankings and sales counts in this article come from that file.
- Windsor Today, Windsor house prices fall £23,577 in a year to £575,036, 22 September 2026, for the July figures as first published.
Have your say