
Windsor and Maidenhead homes fell 2.2% in the year to June 2026, the 26th steepest drop of 295 English districts. Every property type lost value.
The average home in Windsor and Maidenhead sold for £576,992 in June 2026, down £12,818 on a year earlier. That is a fall of 2.2 per cent, and it happened while prices in England as a whole rose 1.8 per cent.
It puts the Royal Borough among the sharpest fallers in the country. Of the 295 local authority districts in England, only 62 recorded any annual fall at all, and Windsor and Maidenhead’s is the 26th steepest of the lot. The company it keeps at that end of the table is mostly inner London: Westminster down 25.4 per cent, Kensington and Chelsea down 14.7 per cent, Camden down 7.1 per cent.
These are completed sales recorded by HM Land Registry in the UK House Price Index, not asking prices. The figure is a mean average, not a median, so a handful of large sales in Cookham or Sunningdale pull it upwards. The borough is a unitary authority, so one number covers Windsor, Maidenhead, Ascot, Eton, Datchet, Old Windsor, Cookham, Bray, Sunningdale, Sunninghill, Wraysbury and the Walthams.
Every type of home lost value
There is no hiding place in the June figures. All four property types are worth less than they were a year ago, and so is the first-time buyer average.
| Type | June 2025 | June 2026 | Change |
|---|---|---|---|
| Detached | £1,160,801 | £1,125,462 | −£35,339 (−3.0%) |
| Semi-detached | £609,669 | £603,738 | −£5,931 (−1.0%) |
| Terraced | £488,752 | £482,009 | −£6,743 (−1.4%) |
| Flat | £317,727 | £307,888 | −£9,839 (−3.1%) |
| First-time buyer | £438,777 | £429,944 | −£8,833 (−2.0%) |
| All types | £589,810 | £576,992 | −£12,818 (−2.2%) |
The top and bottom of the market fell hardest. Detached houses lost 3.0 per cent and flats 3.1 per cent, while semis and terraces gave up around a per cent. In cash the detached fall is the one that stands out: £35,339 off the average, which is more than the entire annual fall on a flat.
The borough is still the 18th most expensive district in England, and detached homes here still average over £1.1 million. Nothing in these numbers makes Windsor and Maidenhead cheap. They make it slightly less expensive than it was.
Berkshire is not moving together
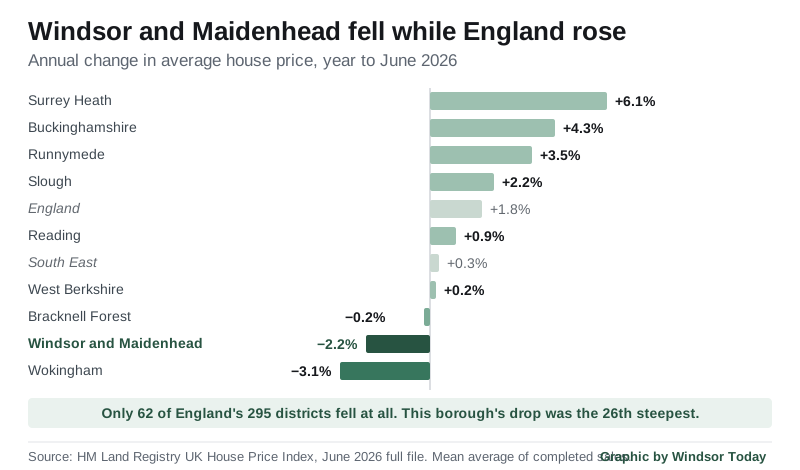
The most striking thing about June is how differently the borough is behaving from the places next to it. Slough, six miles away, is up. So is Buckinghamshire across the river.
| Area | Average price | Annual change |
|---|---|---|
| Windsor and Maidenhead | £576,992 | −2.2% |
| Wokingham | £498,941 | −3.1% |
| Buckinghamshire | £490,508 | +4.3% |
| Bracknell Forest | £396,103 | −0.2% |
| West Berkshire | £402,790 | +0.2% |
| Reading | £361,243 | +0.9% |
| Slough | £352,024 | +2.2% |
| England | £293,262 | +1.8% |
Windsor and Maidenhead remains the most expensive district in Berkshire, £78,051 above Wokingham and £224,968 above Slough. But Slough has closed that gap by £20,287 in a year, because one went up and the other came down.
Only Wokingham fell faster in the county, at 3.1 per cent, which ranks 19th of the 295 English districts. The two dearest parts of Berkshire are the two that are falling. That is the pattern across the whole table: Surrey Heath, Buckinghamshire and Runnymede all rose, and none of them carries an average anywhere near £577,000.
May’s figure has already been rewritten
Anyone who read the May number should know it has changed. When the May 2026 release came out, the Windsor and Maidenhead average was published as £584,743, an annual rise of 0.2 per cent. In the June release the same month is restated as £582,192, an annual fall of 0.3 per cent.
That is a downward revision of £2,551, and it flips the sign. The UK House Price Index is revised every month as more completed sales are registered, and the most recent months move the most. Our own Windsor house prices page has been updated to the June figures.
The revision matters because it changes the shape of the year. On the current data the borough has recorded an annual fall in six of the last seven months:
- December 2025: down 1.8%
- January 2026: down 3.5%
- February 2026: down 3.3%
- March 2026: down 1.4%
- April 2026: up 1.4%
- May 2026: down 0.3%
- June 2026: down 2.2%
Sales are thin, and the comparison is distorted
The Land Registry does not publish a sales count for the two most recent months, because registrations are still coming in. The latest usable figure is April 2026, when 86 homes were sold across the whole borough.
Be careful comparing that with 2025. The stamp duty thresholds changed on 1 April 2025, and the rush to beat it warps the record: the borough logged 372 sales in March 2025 and just 72 in April 2025. Against those, March 2026’s 119 and April 2026’s 86 look like a market that has settled at a much lower volume rather than one that has collapsed.
What it means for you
If you are selling, the borough average is £12,818 below where it was last June, and the mid-market types held up best. A semi is down about one per cent on the year. A large detached house is down three times that, and is where the negotiating is happening.
If you are buying, the arithmetic has moved in your favour for the first time in years, but only slightly and only here. Cross the border into Buckinghamshire or Surrey Heath and prices are rising 4 to 6 per cent. The saving is local to this borough and to Wokingham.
If you are a first-time buyer, the average is now £429,944, down £8,833. That is still £184,494 above the England first-time buyer average of £245,450, and the deposit implications of that gap have not changed.
If you are watching a monthly number, wait for the revision. May moved by £2,551 and changed direction. Treat any single month’s figure as provisional for at least two more releases.
Our Windsor house prices page breaks the borough down by post town, property type and postcode sector, using median sale prices rather than the mean. Windsor planning news tracks what is being built.
Sources
- HM Land Registry UK House Price Index, Windsor and Maidenhead, June 2026.
- UK HPI full file for June 2026, used to rank all 295 English local authority districts and to draw the neighbour comparison from one consistent dataset.
- UK House Price Index entries for Slough, Wokingham, Bracknell Forest, Reading, West Berkshire, Buckinghamshire, Runnymede, Surrey Heath, the South East and England, June 2026.
The UK House Price Index is a mean average of completed sales, not a median, and is revised in every subsequent release. Figures were taken from the June 2026 release on 22 August 2026.
Have your say